Exposing Disinformation
Through Education
Product Demo

Our Mission

Educating social media users about their exposure to disinformation online.

Tweet Collection

Collect historical Twitter data for US congressional members from our partners and combine with the latest tweets pulled from the Twitter API.

Model Application

Apply eight pre-built models selected from existing research and create an aggregated score at the user-level.

Custom Reporting

Display results in an interactive dashboard allowing users to search for their favorite US politicians and learn more about the disinformation score they received and why.

The Problem

Media disinformation has the power to negatively impact countless lives and is often used to marginalize at-risk members of the population. It can spread like wildfire and the detection of fake news is often not simple. Our hope is to spread awareness and increase education by creating easy-to-understand scoring mechanisms for influential Twitter users' content.

Video Demo

Our Product

Learn more about our product's inner workings.

Our product's dataset contains approximately 500,000 tweets published between 2022-2023 from 485 US Congress members. To collect the latest 100 tweets per politician, we created pipelines to extract this data using the Twitter API, and for historical tweet data, we used our partner Torch’s platform to extract tweets in CSV files. The politicians’ metadata including their Twitter handle, party affiliation, political office, and state/district was pulled from secondary sources including Press Gallery House and UC San Diego. Below is an example of a tweet that was obtained from the data sources:

Tweet Example

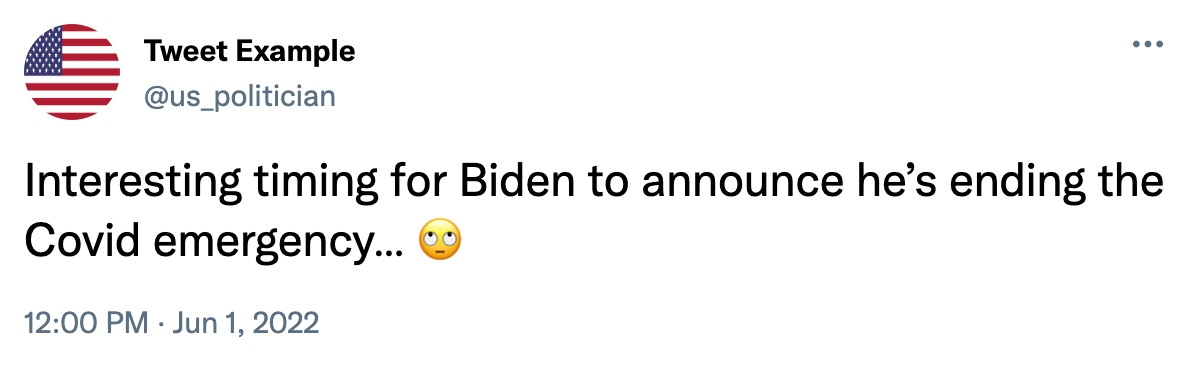
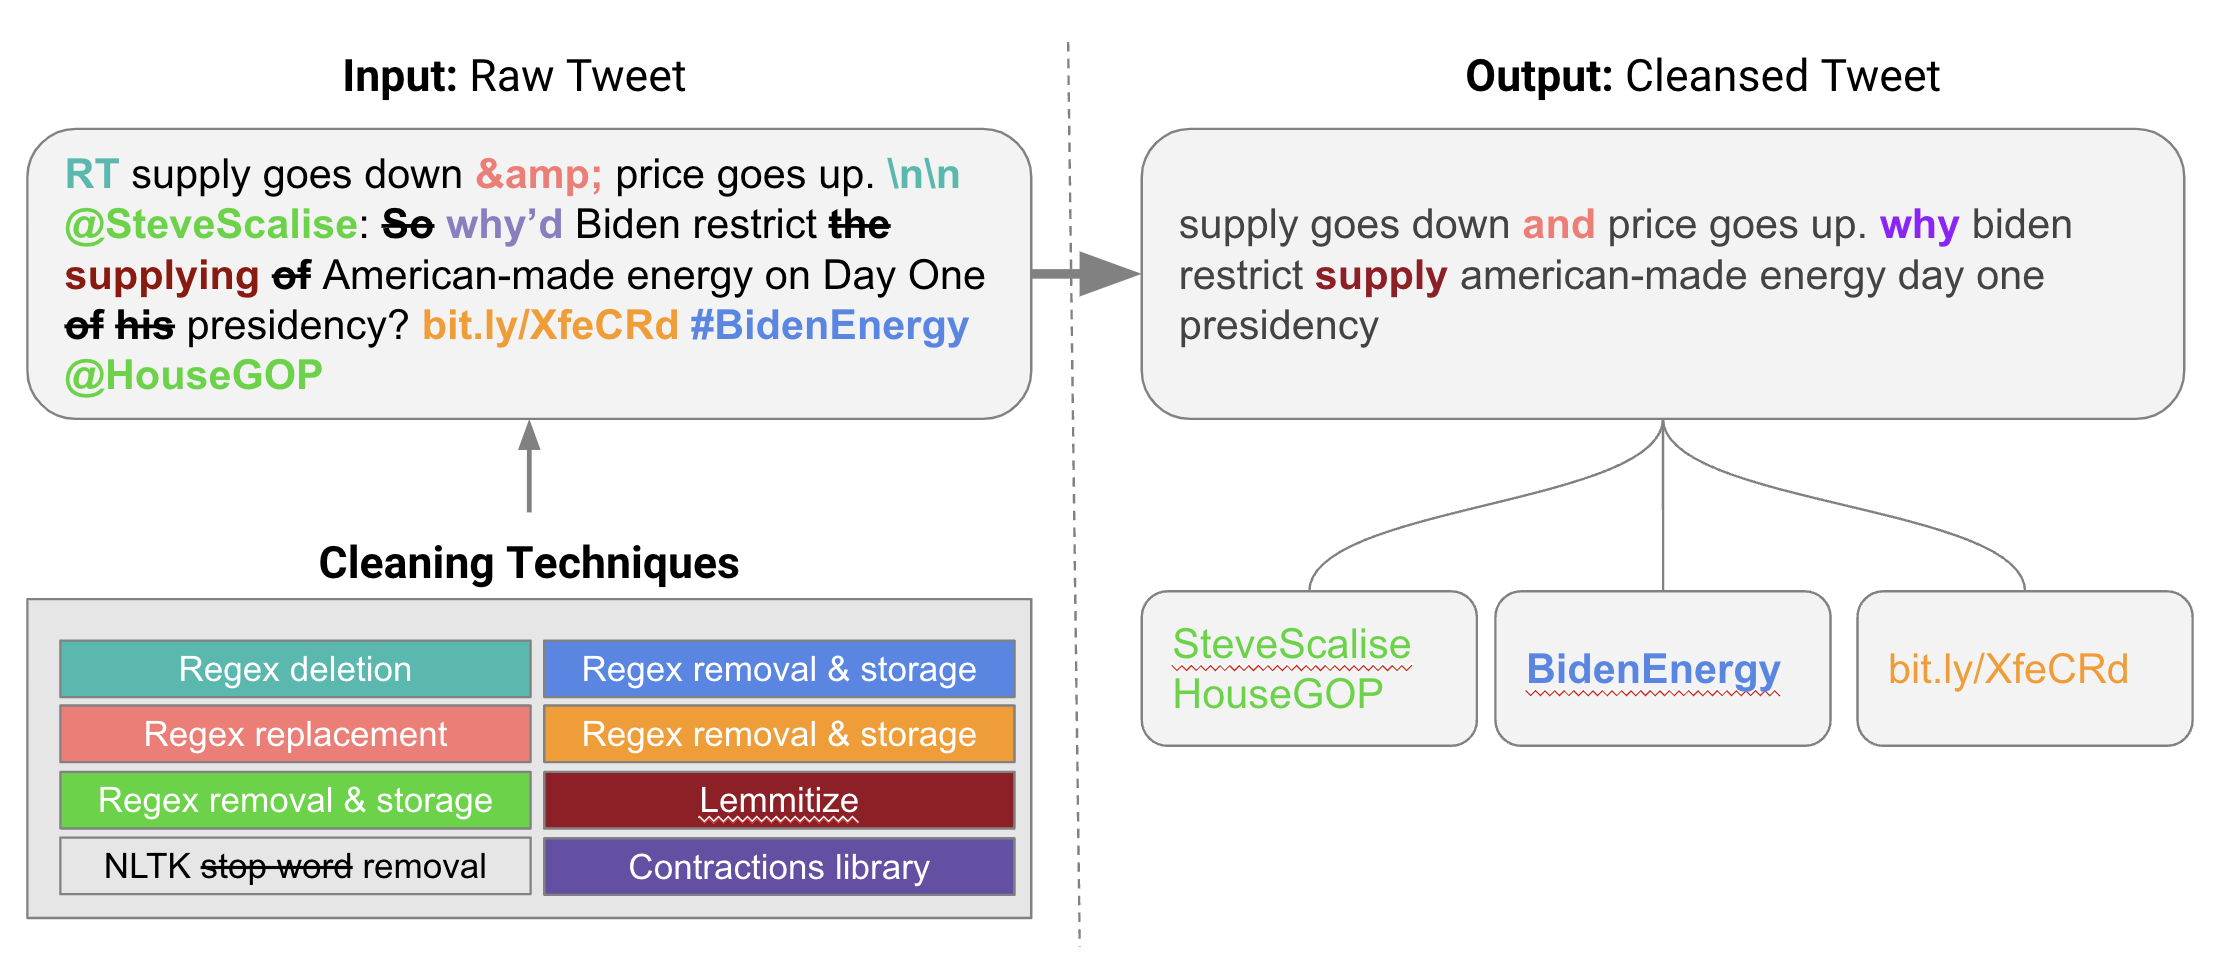
Text from tweets was cleaned up in order to run inside of the pre-trained models. Non-standard symbols were trimmed and content such as links and common stopwords were removed from the corpus. Lastly, different variations of the same word were lemmatized so that they were evaluated the same way in the models. Ultimately, the cleansed version of the tweet example above would look like: [“interesting”, “time”, “biden”, “announce”, “ending”, “covid”, “emergency”]

Tweet Example

Some initial observations were drawn upon reviewing the data. The average politician in our dataset produced 630 tweets per year, of which the most popular themes were healthcare, gun violence, energy, inflation, and infrastructure. In terms of who was referenced within the tweets, the most common subjects were the President of the US, the members from the partisan left and right wing, and media outlets like Fox News.

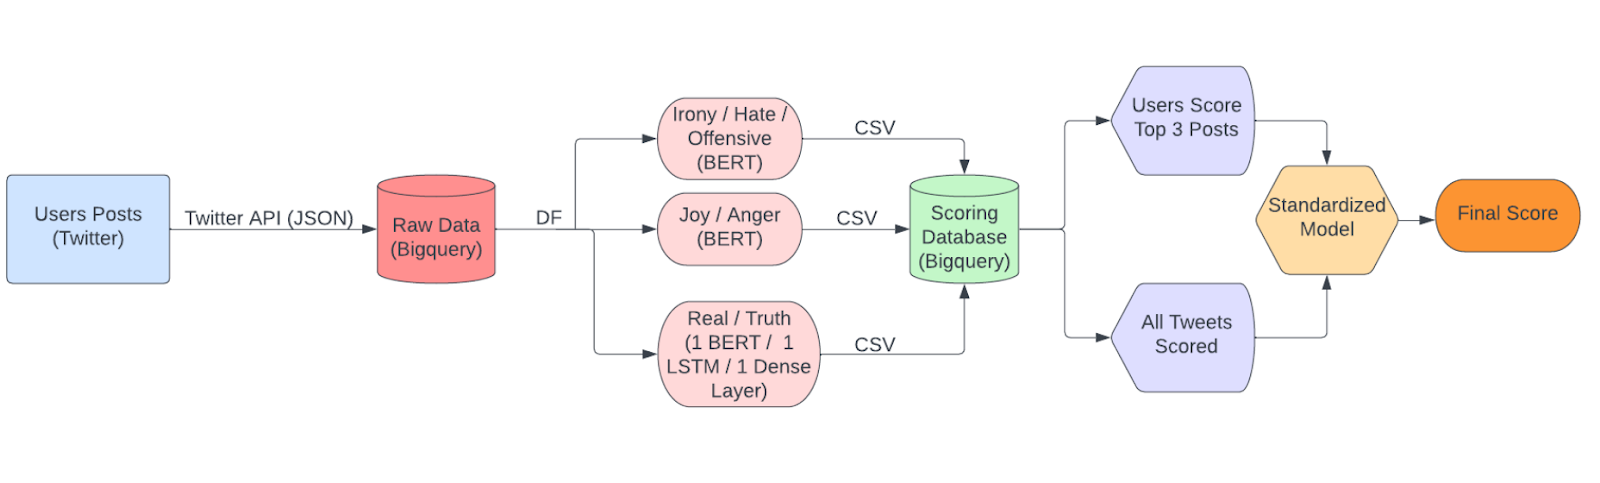
We have two parts to our modeling: 1) scoring text with existing research models; 2) aggregating scored text to evaluate each Twitter user. We incorporated existing research on detecting truthfulness and sentiment with large language models into our pipeline to score tweet content. We used a total of eight pre-built models including three models for detecting the truthfulness of tweets and five sentiment models for detecting the emotions evoked by tweets:

  1. Long Short-Term Memory (LSTM): Truth
  2. Dense Layer: Truth
  3. Cardiff Model: Irony
  4. Cardiff Model: Hate
  5. Cardiff Model: Offensive
  6. Cardiff Model: Real
  7. Cardiff Model: Joy
  8. Cardiff Model: Anger

Each model was trained on various datasets. For example, the 5 sentiment models were trained using the following datasets:

  • The irony detection task determines whether a tweet includes ironic content or not and the model used the Subtask A dataset of the SemEval2018 Irony Detection challenge (Van Hee et al., 2018).
  • The hate speech detection task determines whether a tweet is hateful or not against any of two target communities: immigrants and women. The dataset of choice stems from the SemEval2019 Hateval challenge (Basile et al., 2019).
  • The offensive language detection task identifies whether some form of offensive language is present in a tweet. The model used the SemEval2019 OffensEval dataset (Zampieri et al., 2019).
  • This emotion recognition task consists of recognizing the emotion evoked by a tweet. We specifically looked at joy and anger for the purposes of our project and used the dataset for the most participated task of SemEval2018, “Affects in Tweets” (Mohammad et al., 2018).
  • To create a composite score for each user, all tweets are scored, scaled using a standard scaler, and added together. For example, starting with 8 different scores for each tweet, we scale them so that 0 is neutral, positive is good behavior, and negative is bad behavior. These 8 scaled model scores are summed together for a composite score for each tweet of a particular user. Then, we calculate the average composite tweet score for each user to arrive at an aggregated score. This final aggregated score represents how susceptible that individual Twitter user is to spreading disinformation.

    Check out the "Our Models" section to learn more about each individual model.

    Given that many of our models assess sentiment, which is largely subjective, it was quite challenging to assess model performance objectively. Even for a matter such as truth, the difficulty lies in how to rate statements that merely constitute an opinion, or are roughly true but contain a small falsehood. Thus, aside from confirming the validity of models within an individual context by referencing the sources they came from, human evaluation was another approach taken to determine how agreeable the model outputs would be, on average, in comparison to a human observer.

    In general, our chosen models had promising results in terms of sentiment and text analysis, and also served to demonstrate potential shortcomings and challenges to overcome in their next iterations. While they overall did well in detecting the negative sentiments of hate, irony, and offensiveness within tweets, truth detection was a much more difficult problem. When comparing human ratings to their equivalent model outputs, the model scores differed from their human counterparts by an average of 15% in the sentiment-based models, but a whopping 52% in the truth-based models.

    These numerical figures should be taken with a grain of salt, however. Even between human evaluators, there was a measured difference of 3% and 17%, respectively, between different human ratings. Thus, part of this discrepancy can be explained as the objective difficulty in rating the truthiness of many short statements (evident in the person-person score differences), while another part could potentially be chalked up to the limited body of text that is present in tweets. It appears that certain models may rely on a larger corpus of text in order to detect idiosyncrasies and false statements.

    Interestingly, the truth sentiment graphs largely seemed to agree with one another, which suggests that they might be “thinking” the same way. Further steps to improve the model may constitute undertakings such as integrating the text or image within links as an input, using retweets, likes, and comments to add context to individual scores, and continuing the cluster analysis in model combination to determine if any interesting groups of users emerge.

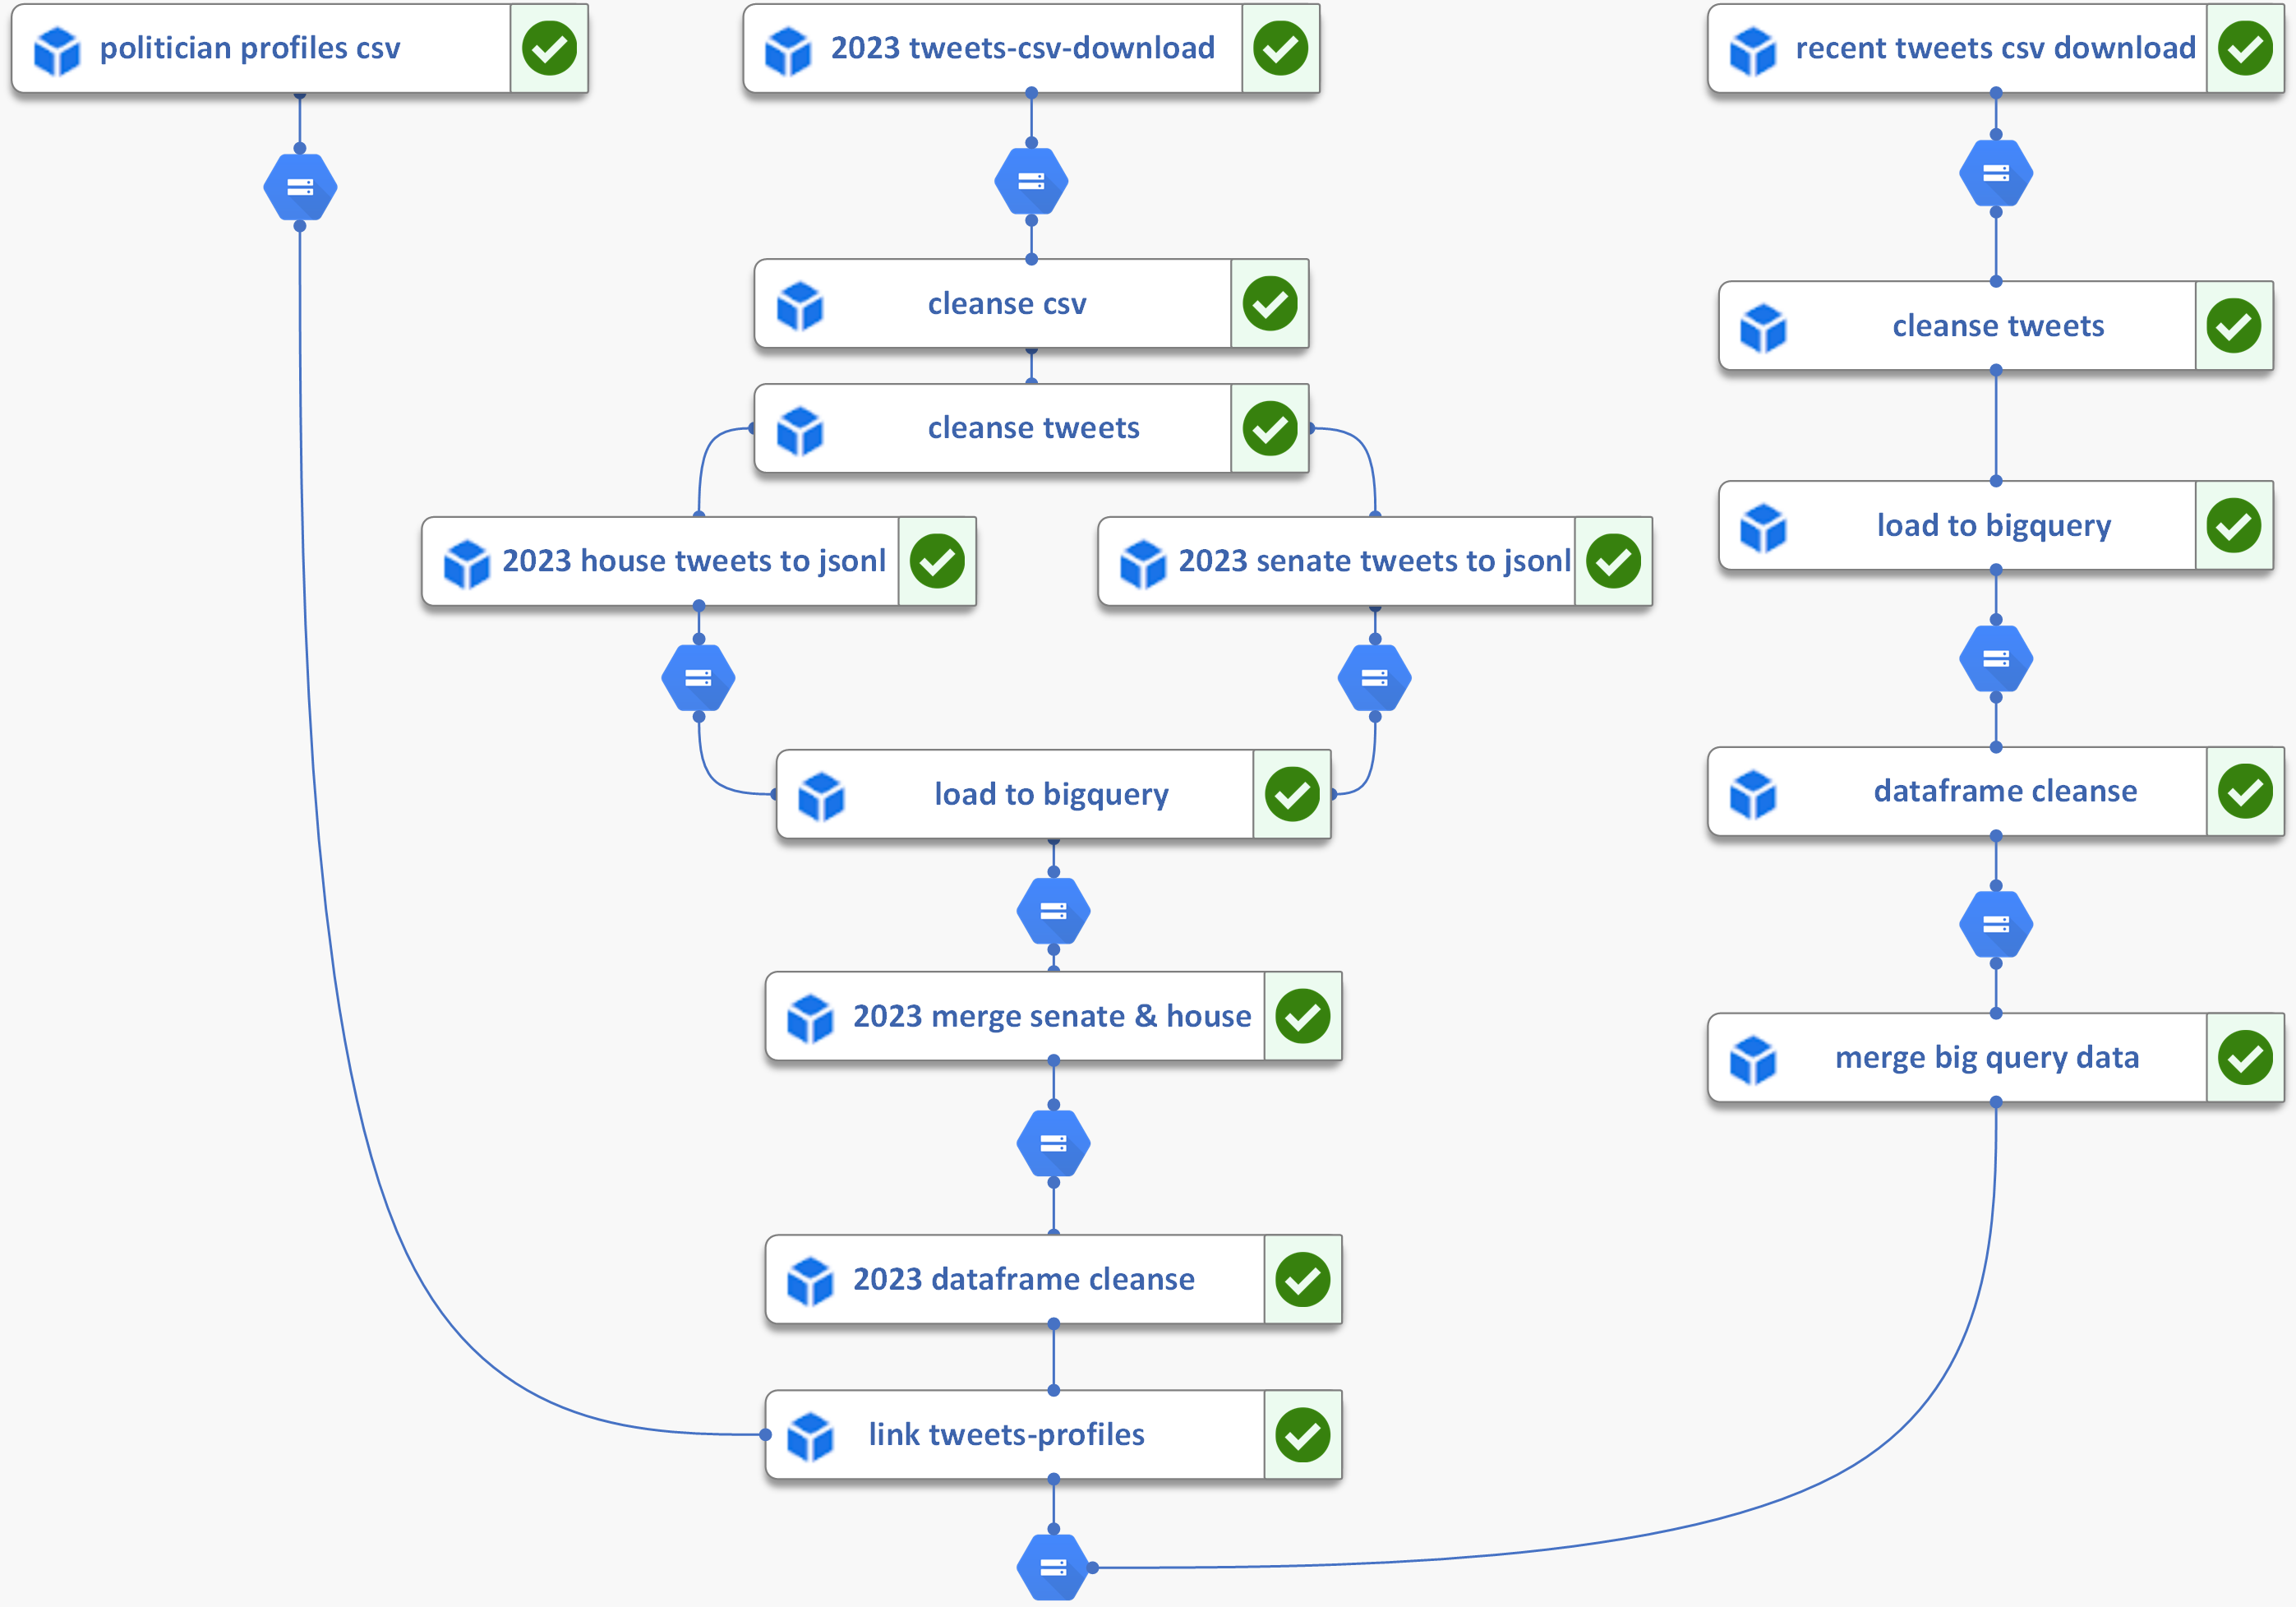
    Our product's data pipeline includes the following components:

  • Twitter API: The data pipeline retrieves tweets from the Twitter API. The pipeline can use different APIs provided by Twitter, such as the Twitter Streaming API or the Twitter Search API. For this project the Twitter API used was the user lookup and tweet lookups search functionality.
  • BigQuery: The data pipeline uses BigQuery as a cloud-based data warehouse to store and analyze large volumes of data. It integrates well with other Google Cloud Platform services, and in this case, it serves as a data storage and processing layer.
  • Tweet Analyzers: This is a machine learning-based tool used in the data pipeline to analyze the intent of the tweets pulled from Twitter.
  • User Segmentation: The final output of the data pipeline is user segmentation based on the model scores calculated for each tweet. The data pipeline groups users into different segments based on their overall sentiment, such as positive, negative, or neutral.
  • Here's how the data pipeline works:

  • The data pipeline retrieves tweets from the Twitter API.
  • The data pipeline stores the tweets in BigQuery which serves as the data storage and processing layer.
  • Tweet Analyzers are used to analyze the sentiment of each tweet and provide a score from 0 to 1 on how each sentiment is scored.
  • Based on the sentiment scores, the data pipeline groups users into different segments.
  • The final output of the data pipeline is a set of user segments that can be used to gain insights into user behavior based on their disinformation score.
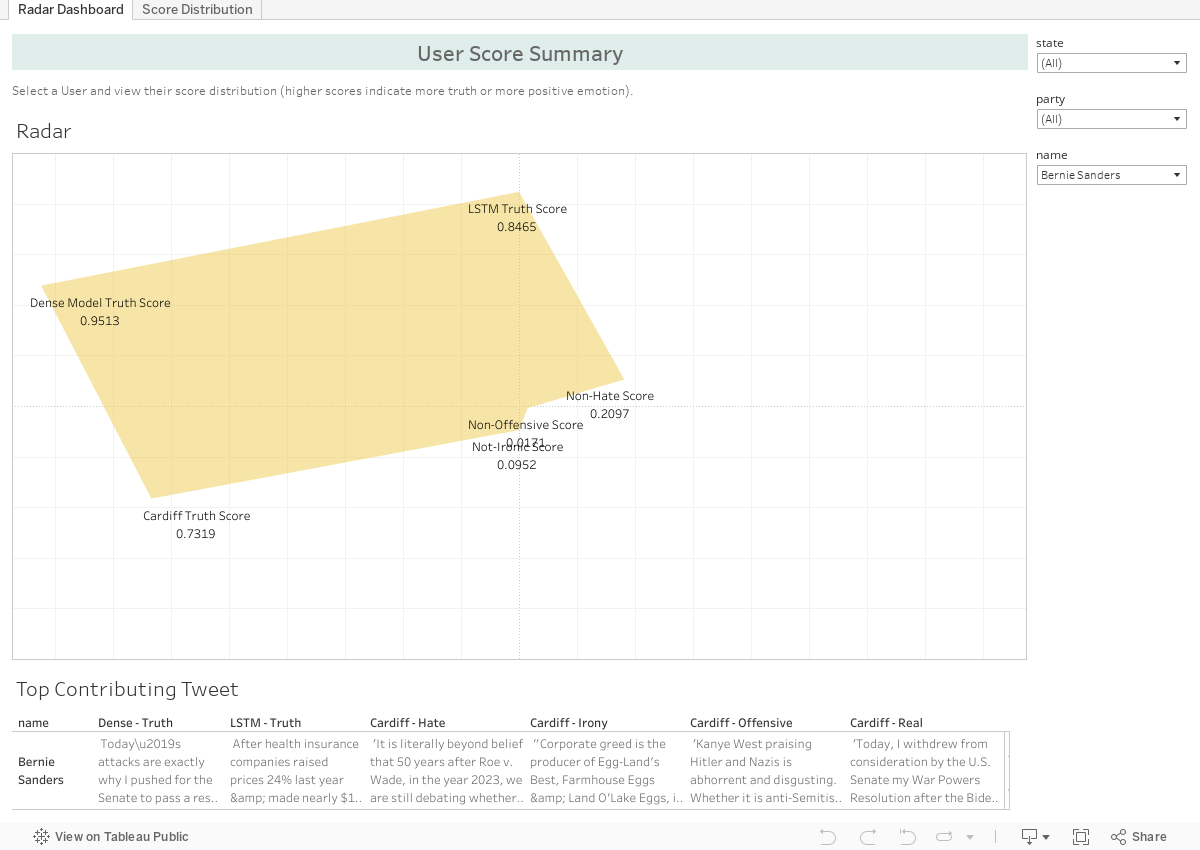
  • How to Interpret the Radar Plot

    The radar plot shows the performance of six models for a selected user. The scores represent the politician's rank, also called percentile, compared to other politicians across six domains of interest. The models initially scored politicians on a scale from 0 to 1 and ranked the results to obtain a value. The value indicates how the user performs compared to others. For example, a score of 93% in one category suggests that the user performs better than 93% of other users but worse than 7% (100 - 93 = 7) of users. A larger graph with a hexagonal shape indicates better performance compared to other users and suggests the user has an overall positive influence on the Twitter network.

    In summary, the radar plot provides a representation of a politician's relative performance across multiple domains of interest and visualizes an overall pattern of behavior of a user on Twitter.

    How to Interpret the Distribution Plot

    The distribution plot displays the distribution of values obtained/calculated from the last 100 tweets for the selected politician. The x-axis indicates the tweet’s rank, also called percentile, for a selected model/score. The y-axis represents the count of tweets per percentile bucket. A high peak approaching the 90th percentile suggests that a significant number of the politician's tweets outperform those of other politicians in the selected domain of interest.

    In summary, the distribution plot provides a representation of a politician's tweet performance in a domain for a given model. It indicates whether their tweets perform better or worse than those of other users.

    Our Models

    Learn more about the models we used to score Twitter posts.

    Long Short-Term Memory Model

    Long Short-Term Memory

    An Artificial Neural Network

    Dense Layer Model

    Dense Layer

    An Artificial Neural Network

    Cardiff Models

    Cardiff

    Tweet Sentiment Classification

    Ethics & Limitations

    Learn more about our product's ethical considerations and limitations.

    Our team’s intention for building this product is to educate social media users, but we must acknowledge that it has the potential to be used in ways that go against our mission and values. The models we use to score tweets on truthfulness and sentiment have limitations and possible biases as they are only as good as the data they were trained on. While we strive for accuracy, there are limitations to these methods, including variations in the interpretation of language and the subjective nature of determining what constitutes "fake news." Therefore, the scores should be taken as indicative rather than definitive.

    This project aims to (1) inform Twitter users about the content that politicians are sharing on the platform and (2) inform politicians about how they might be contributing to the spread of fake news. We strongly advise our viewers to review the "Our Product" section for how to critically interpret and evaluate the results of a given politician. When in doubt, please feel free to reach out to anyone on our team and we would be happy to help.

    It is essential to use these scores alongside other sources of information (such as FactCheck.org or Politifact) and critical thinking to make informed decisions.

    As a team, we recognize the potential impact of our work and have taken steps to ensure we review any breaches to our ethical values and principles. Some of the measures taken include:

  • We used publicly available Twitter data from US politicians.
  • We worked to avoid any bias or discrimination in our analysis by employing rigorous statistical methods to ensure that our results are meaningful and representative.
  • We ensured that our project is transparent and that we provide clear disclaimers about the limitations of our methodology.
  • We aimed to use our project to promote greater transparency and accountability among US politicians on Twitter with the ultimate goal of improving the quality of information available to social media users.
  • We provide an opportunity for US politicians to benefit from the project by critically reviewing their impact on the spread of disinformation on Twitter.
  • We acknowledge that our work is part of a broader societal conversation about the role of technology in democracy, and we are committed to ensuring that our project contributes to this conversation responsibly and ethically.

    Methodology Limitations

    As with any data science project, there are limitations to the methodology we have used in scoring politicians based on their tweets.

  • Fake news detection and sentiment analysis are not perfect, and errors can occur due to language nuances, emotions, and other factors that may be difficult to detect algorithmically.
  • Our scoring system relies solely on Twitter data, which may not provide a complete picture of a politician's record or views.
  • Our project may be subject to biases inherent in the data we used.
  • The project focuses on US politicians tweet content, which may not provide a complete picture of the politicians’ community and perspectives.
  • While we have taken steps to ensure that our project adheres to ethical principles, we acknowledge that there may be unpredictable, unintended consequences or ethical implications that we need to consider further. We encourage users to interpret our results with these limitations in mind and to use our project as one of many sources of information when making decisions about politics and public discourse.

    Model Limitations

    Overall, our models present a promising start in terms of sentiment and text analysis, as well as highlight potential shortcomings and challenges to overcome in the next iterations of our models. While they overall perform strongly in detecting the negative sentiments of hate, irony, and offensiveness within tweets, there is much room for improvement when it comes to truth detection. When comparing human ratings to their equivalent model outputs, the model scores differed from their human counterparts by an average of 15% in the sentiment-based models, but a whopping 52% in the truth-based models.

    These numerical figures should be taken with a grain of salt, however. Even between human evaluators, there was a measured difference of 3% and 17%, respectively, between different human ratings. Thus, part of this discrepancy can be explained as the objective difficulty in rating the truthiness of many short statements (evident in the person-person score differences), while another part could potentially be chalked up to the limited body of text that is present in tweets. It appears that certain models may rely on a larger corpus of text in order to detect idiosyncrasies and false statements. As an example, consider the following tweet:

    Tweet Example

    All three of the truth-based models were relatively skeptical about this tweet. Even though the human evaluators were able to search and verify the truthfulness of this claim, as well as view the accompanying photo of this politician with the cited individuals, the present-day models neither process images nor digest links, so they struggled with what was essentially “proper noun soup” - i.e. many organization/individual names without much context in between for semantic processing, since this tweet is essentially just a list of entities.

    Given the limitations of resources present during development, it is also likely that future iterations of our models would perform better than the present-date MVP presented here. Future iterations of the truth models would likely pull information present in linked text, as well as seek to understand more contextual factors in determining the truthfulness of more tweets. They may also employ more sophisticated flavors of models, such as large language models that revise and improve upon their performance given feedback (most notably, models akin to those used in OpenAI’s ChatGPT chatbot).

    Please reach out to a member of our team if you are interested in viewing the raw model rating outputs from our human graders.

    Our team has not explicitly given notice to the US politicians on Twitter regarding the use of their data for our project as this information is publicly available. Every Twitter user has consented to Twitter's Terms of Service and Privacy Policy, which permits this data to be collected under these conditions. Having said that, it important to note that there is no informed consent process as these Twitter users may not understand nor accept that our project has assigned them a disinformation score using their data.

    There is no formal process for these Twitter users to decline or “opt out” from the use of their data in our product unless the user does not publicly post content on Twitter (i.e., private or inactive account). However, if a team member is contacted, then we will immediately remove their Twitter data from our product’s data stores and Tableau Public dashboard.

    Because our product uses publicly available data from Twitter’s API, we do not require a System of Records Notice (SORN). Our product follows Twitter’s Privacy Policy detailing the types of personally identifiable information (PII) that is allowed to be collected and stored. Thus, the only PII we have collected and stored is Twitter users’ handles and basic profile information.

    Our Team

    Akiko Iwamizu

    SME & App Development

    Brook Bi

    Project Management

    Giorgio Soggiu

    Exploratory Data Analysis

    Jason Yang

    Product Management

    Razal Minhas

    ML Engineering

    Rohin Chabra

    Data Engineering